Documentation
Complete user guide for SciPathJ
Introduction
SciPathJ (Segmentation and Classification of Images - Pipeline for the Analysis of Tissue Histopathology) is a Java-based software designed for automated analysis of H&E-stained microscopy images.
The software provides a complete pipeline for:
- Automated segmentation of cells, nuclei, cytoplasm, and vessels
- Extraction of 150+ morphological and color features
- Custom cell class definition and training
- Machine learning-based cell classification using XGBoost
- Batch processing of entire image folders
Installation
System Requirements
- RAM: 4 GB minimum (8 GB recommended for large images)
- Disk Space: 500 MB for the installer + 700 MB for the installed program
- Operating System: Windows 10/11 (64-bit)
Standalone Installation
SciPathJ is distributed as a Windows executable installer that guides you through the installation process:
- Download the installer (.exe) from the Download page
- Double-click the installer to launch the setup wizard
- Follow the on-screen instructions to complete the installation
- Launch SciPathJ from the Start Menu or desktop shortcut
The installer will automatically handle all dependencies and create the necessary shortcuts for easy access.
ImageJ/Fiji Plugin (Legacy Version)
Note: The ImageJ/Fiji plugin version is a discontinued legacy version and is no longer actively maintained. It may not include the latest features and improvements available in the standalone version.
For instructions on how to install the legacy plugin version, please watch our video tutorial:
Main Interface
Overview
The SciPathJ main interface is designed to be intuitive and user-friendly, providing easy access to all analysis tools and settings.
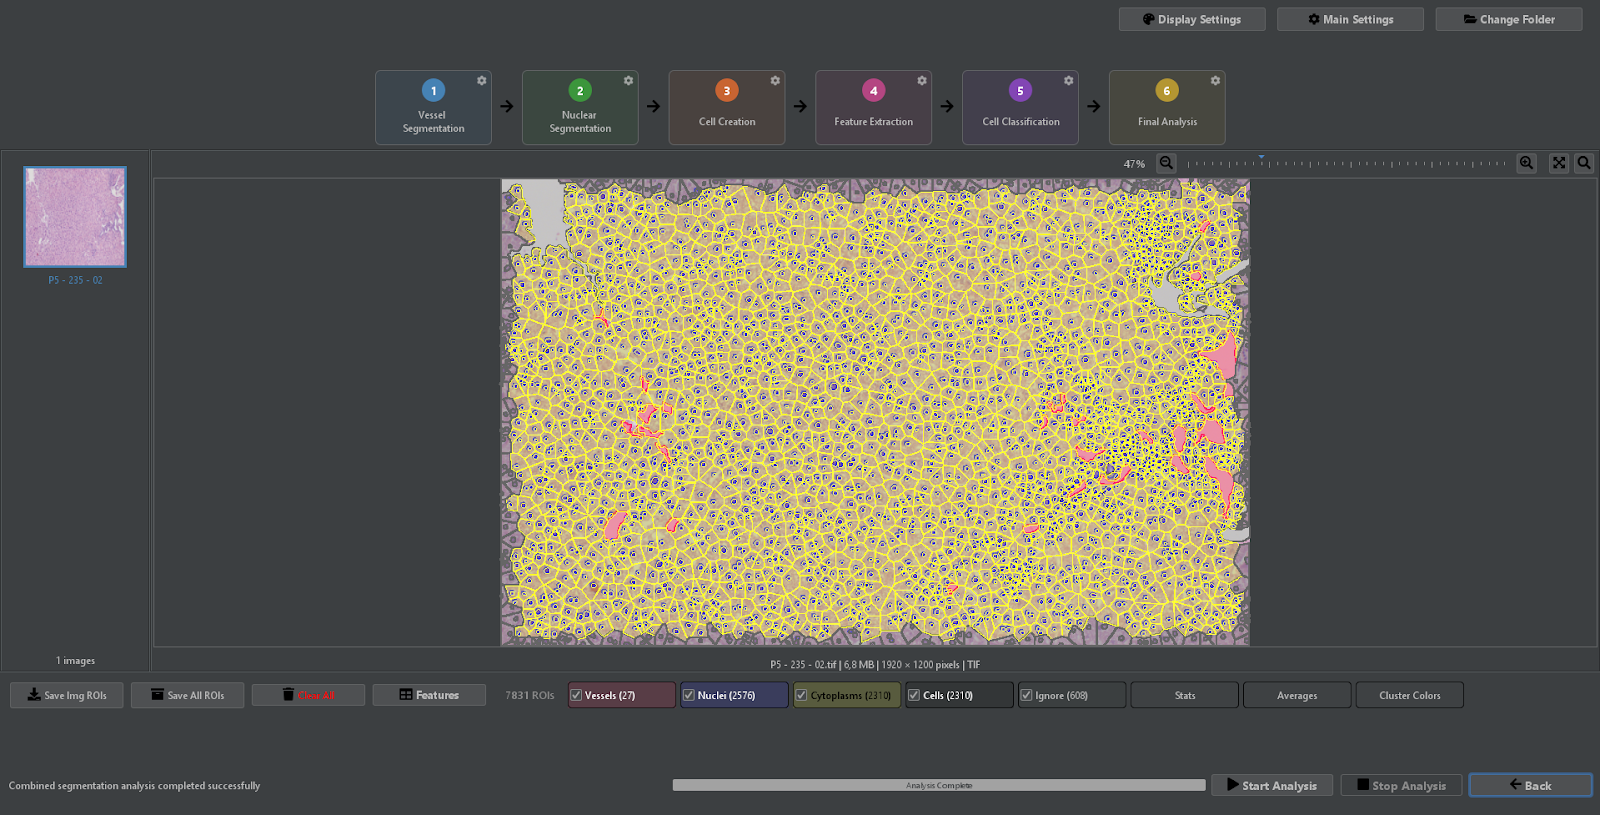
SciPathJ Main Interface Overview
1. Workflow Pipeline
The top bar displays the sequential steps of the analysis pipeline. You can click on each step to configure its specific parameters:
- Vessel Segmentation: Detect and delineate vascular structures.
- Nuclear Segmentation: Identify cell nuclei using hematoxylin staining.
- Cell Creation: Combine nuclei and cytoplasm to define complete cells.
- Feature Extraction: Calculate morphological and intensity measurements.
- Cell Classification: Train and apply machine learning models to classify cells.
- Final Analysis: Generate summary statistics and reports.
2. Global Settings & Navigation
Located at the top right:
- Display Settings: Control overlay colors, transparency, and visualization modes.
- Main Settings: Configure general preferences, memory allocation, and output options.
- Change Folder: Select a different directory for analysis.
3. Image Selection & Canvas
- Left Sidebar: Displays thumbnails of images in the current folder for quick switching.
- Central Canvas: Shows the active image with segmentation overlays. Use the mouse wheel to zoom and click-drag to pan.
- Zoom Controls: Located at the top right of the canvas for precise magnification adjustment.
4. ROI Management & Tools
The bottom toolbar provides tools for managing Regions of Interest (ROIs):
- Save ROIs: Export detected regions as images or data files.
- Clear All: Remove all current segmentations from the image.
- ROI Toggles: Show/hide specific types of detections (Vessels, Nuclei, Cytoplasms, Cells).
- Analysis Tools: Access Stats, Averages, and Cluster Colors for the current image.
5. Execution Controls
The bottom bar manages the analysis process:
- Status Message: Displays the result of the last operation.
- Progress Bar: Shows real-time progress of the current analysis step.
- Start/Stop Analysis: Control the execution of the pipeline.
- Back: Return to the previous screen or folder selection.
Main Settings
Overview
The Main Application Settings panel allows you to configure global parameters for image analysis and data export.
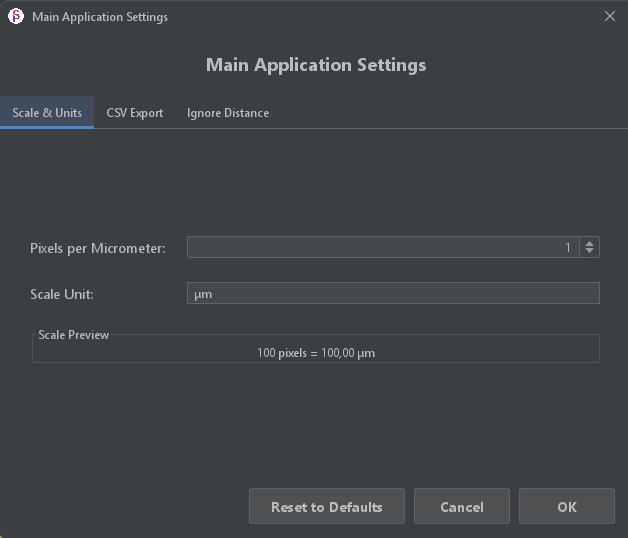
Main Application Settings
Scale & Units
- Pixels per Micrometer: Define the resolution of your images. This value is crucial for accurate area and length measurements.
- Scale Unit: The unit of measurement (e.g., µm).
- Scale Preview: Shows a real-time conversion example based on your settings.
Other Settings
- CSV Export: Configure options for exporting analysis results to CSV files.
- Ignore Distance: Set parameters for excluding regions based on distance.
Display Settings
Overview
The Display Settings panel allows you to customize how Regions of Interest (ROIs) are visualized on the image canvas. You can configure settings independently for Vessel, Nucleus, Cytoplasm, Cell, and Ignore ROIs.
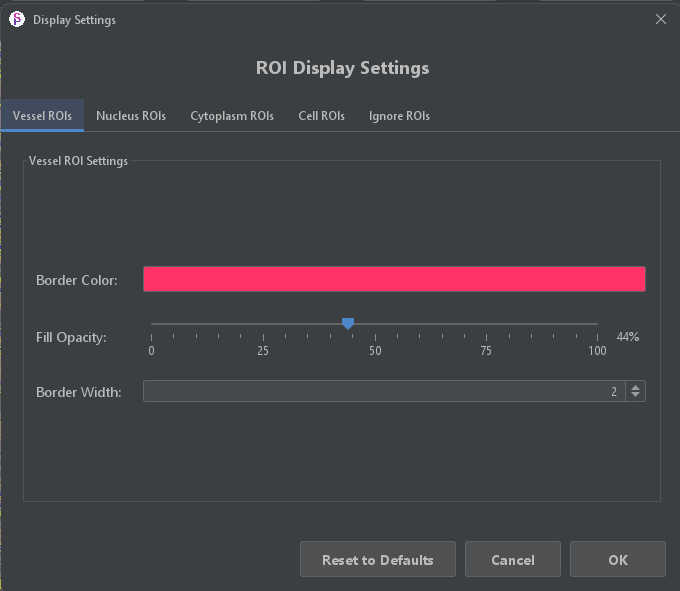
Display Settings
ROI Display Options
- Border Color: Choose the color for the ROI boundaries.
- Fill Opacity: Adjust the transparency of the ROI fill color (0-100%).
- Border Width: Set the thickness of the ROI outlines.
Vessel Segmentation
Overview
The Vessel Segmentation Settings panel controls the parameters for detecting vascular structures.
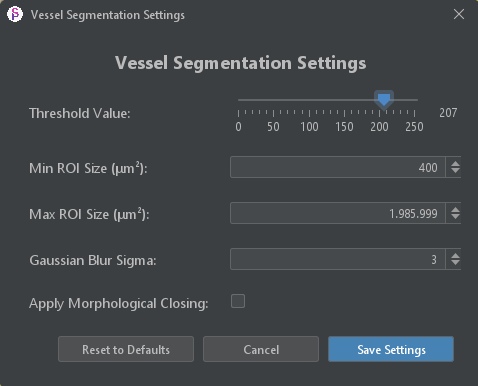
Vessel Segmentation Settings
Thresholding
- Threshold Value: Set the intensity threshold (0-255) for identifying vessel candidates.
Size Filtering
- Min ROI Size (µm²): Minimum area required for a detected region to be considered a vessel.
- Max ROI Size (µm²): Maximum allowed area for a vessel.
Processing
- Gaussian Blur Sigma: Controls the amount of smoothing applied before segmentation to reduce noise.
- Apply Morphological Closing: Enable to close small gaps and smooth boundaries of detected vessels.
Nuclear Segmentation
Overview
The Nuclear Segmentation Settings panel uses the StarDist deep learning model for accurate nucleus detection.
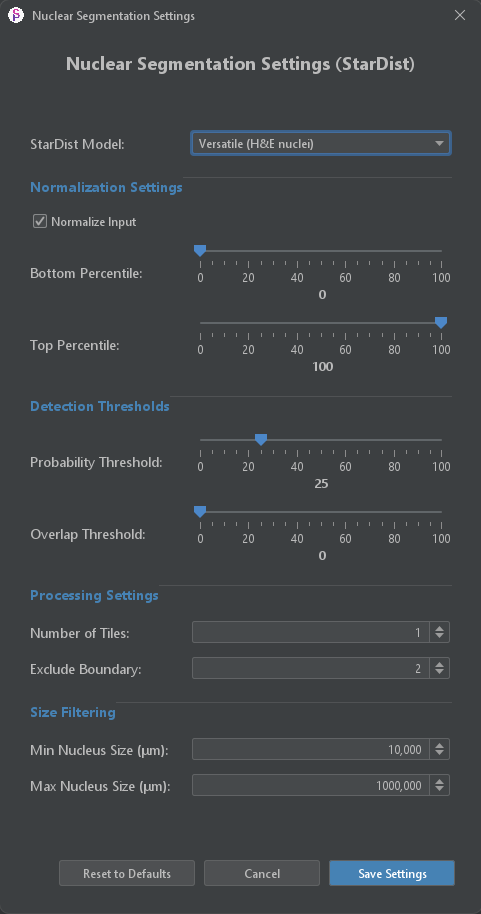
Nuclear Segmentation Settings
Model & Normalization
- StarDist Model: Select the pre-trained model (e.g., Versatile H&E nuclei).
- Normalize Input: Enable input image normalization.
- Percentiles: Adjust the bottom and top percentiles for intensity normalization.
Detection Thresholds
- Probability Threshold: Minimum probability score for a detected object to be accepted as a nucleus.
- Overlap Threshold: Maximum allowed overlap between detected nuclei.
Processing Settings
- Number of Tiles: Split the image into tiles for processing (useful for large images).
- Exclude Boundary: Exclude nuclei detected near the image edges.
Size Filtering
- Min Nucleus Size (µm): Minimum diameter/size for a nucleus.
- Max Nucleus Size (µm): Maximum diameter/size for a nucleus.
Cell Creation
Overview
The Cytoplasm Segmentation Settings panel defines how cell boundaries are estimated around detected nuclei.
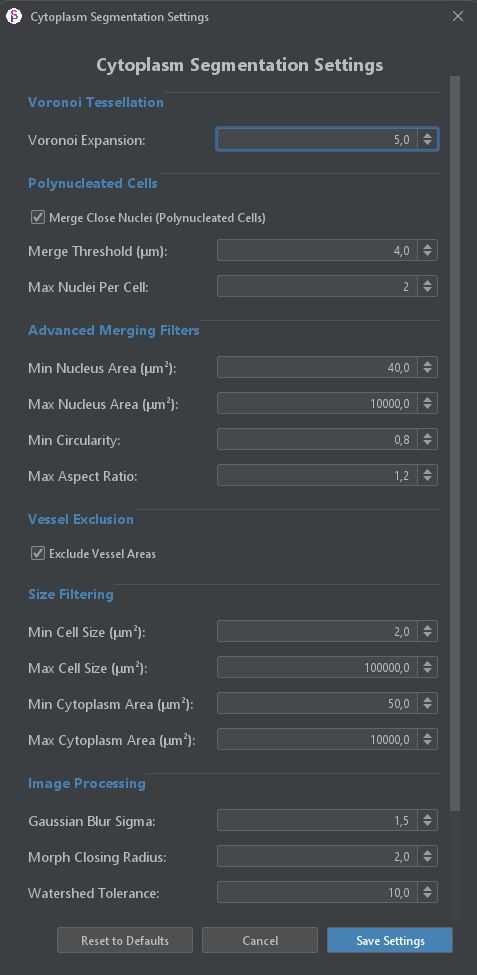
Cytoplasm Segmentation Settings
Voronoi Tessellation
- Voronoi Expansion: Controls the maximum expansion distance from the nucleus to define the cytoplasm.
Polynucleated Cells
- Merge Close Nuclei: Enable merging of nuclei that are close together to form polynucleated cells.
- Merge Threshold (µm): Maximum distance between nuclei to be merged.
- Max Nuclei Per Cell: Maximum number of nuclei allowed in a single cell.
Advanced Merging Filters
- Nucleus Area Limits: Min/Max area constraints for nuclei involved in merging.
- Shape Constraints: Filter based on Circularity and Aspect Ratio.
Vessel Exclusion
- Exclude Vessel Areas: Prevent cell creation within detected vessel regions.
Size Filtering & Processing
- Cell Size Limits: Min/Max area constraints for the final cell.
- Cytoplasm Area Limits: Min/Max area constraints for the cytoplasm region.
- Gaussian Blur Sigma: Smoothing factor for image processing.
- Morph Closing Radius: Radius for morphological closing operations.
- Watershed Tolerance: Tolerance parameter for the watershed algorithm used in separation.
Feature Extraction
Overview
The Feature Extraction Settings panel allows you to select which features to calculate for Cell, Nucleus, Cytoplasm, and Vessel ROIs.
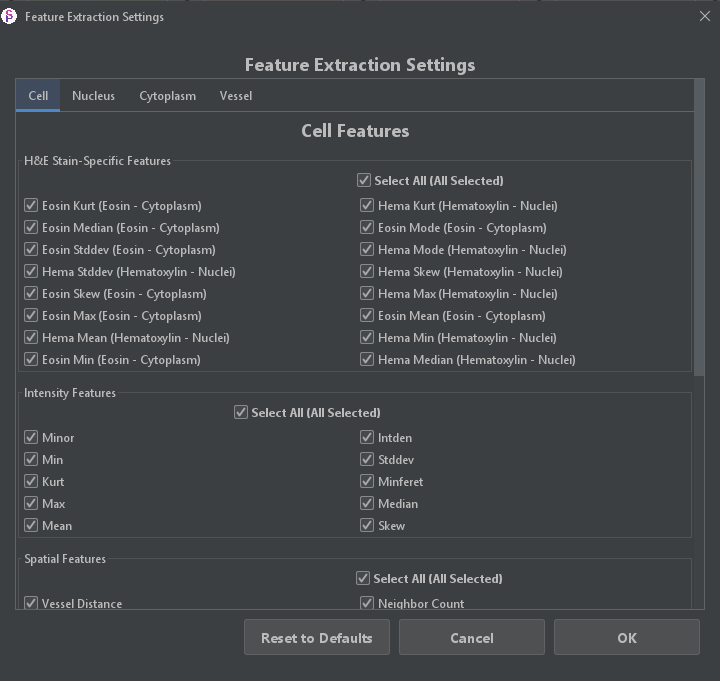
Feature Extraction Settings
Cell Features
Features are categorized into groups:
- H&E Stain-Specific Features: Measurements related to Hematoxylin and Eosin staining (e.g., Mean, Stddev, Skew, Max for both stains).
- Intensity Features: General intensity statistics (Mean, Min, Max, Median, Skew, Kurtosis, etc.).
- Spatial Features: Measurements related to spatial distribution (e.g., Vessel Distance, Neighbor Count).
You can use the "Select All" checkbox to quickly enable or disable all features in a category.
Cell Classification
Overview
The Unsupervised Classification Settings panel allows you to group cells based on their features without prior training.
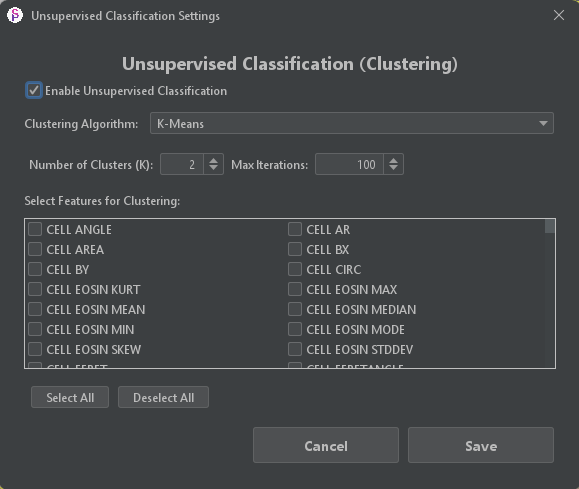
Unsupervised Classification Settings
Clustering Configuration
- Enable Unsupervised Classification: Toggle the classification process.
- Clustering Algorithm: Select the algorithm to use (e.g., K-Means).
- Number of Clusters (K): Define the number of groups to find.
- Max Iterations: Set the maximum number of iterations for the algorithm to converge.
Feature Selection
Select the specific features to use for clustering (e.g., Cell Area, Cell Circularity, Eosin Mean). Only selected features will be used to determine the clusters.
Batch Analysis
Overview
Batch analysis allows you to process multiple images automatically using the same settings.
Setting Up Batch Processing
Instead of selecting a single image, select a folder containing your images:
- Go to File > Open Folder or click the folder icon in the toolbar
- Select the folder containing your images
- Configure all settings panels with your desired parameters
- Click Process > Batch Analysis to start
Supported Formats
- TIFF (.tif, .tiff)
- PNG (.png)
- JPEG (.jpg, .jpeg)
- NDPI (Hamamatsu scanner format)
- SVS (Aperio scanner format)
Output Organization
Batch processing creates an organized output structure:
- One subfolder per image with all results
- Combined CSV files with all features
- Summary statistics across all images
Progress Monitoring
The batch processing window shows:
- Current image being processed
- Overall progress percentage
- Estimated time remaining
- Error log for any failed images
Resume Capability
If processing is interrupted, you can resume from where it stopped. SciPathJ tracks which images have been processed and skips them on restart.
Data Output & Visualization
Overview
SciPathJ provides several tools to visualize and export the analysis results. These can be accessed from the bottom toolbar of the main interface.
1. Extracted Features
The Features window displays a comprehensive table of all measurements calculated for every detected object (Cell, Nucleus, Cytoplasm, Vessel).
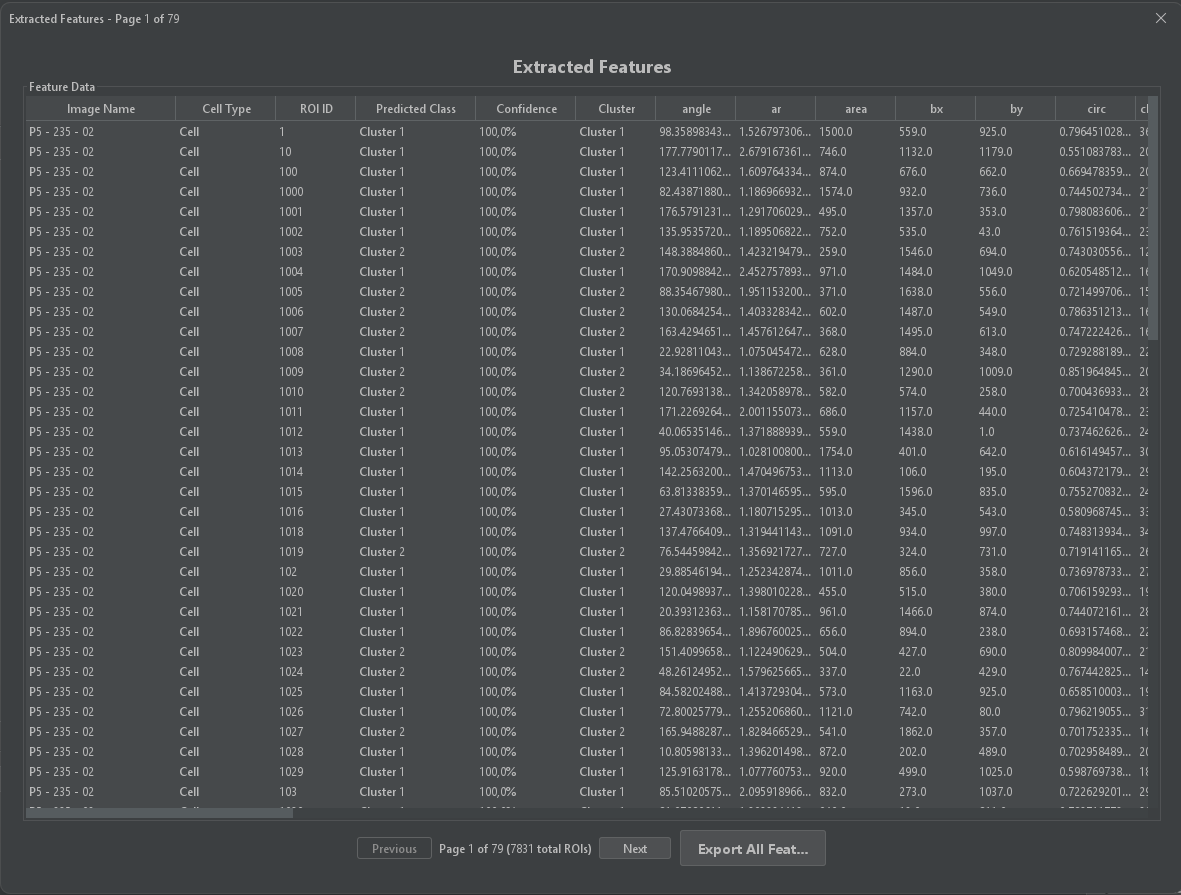
Extracted Features Table
- Data Grid: Shows individual values for each feature (e.g., Area, Circularity, Intensity).
- Navigation: Use the "Previous" and "Next" buttons to browse through pages of data.
- Export: Click "Export All Features" to save the complete dataset to a CSV file for external analysis.
2. ROI Statistics
The Statistics window provides a high-level summary of the analysis results for the current image and the entire batch.
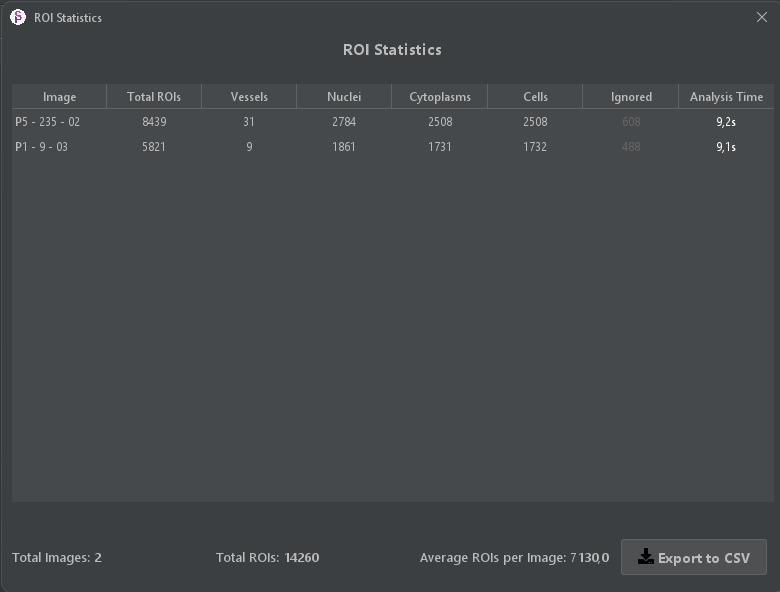
ROI Statistics Summary
- Counts: Displays the total number of Vessels, Nuclei, Cytoplasms, and Cells detected.
- Performance: Shows the analysis time for each image.
- Batch Summary: At the bottom, you can see the total number of images processed and the average ROIs per image.
- Export: Save the summary statistics to a CSV file.
3. Feature Averages
The Averages window calculates the mean value of each feature for every ROI type in the image.
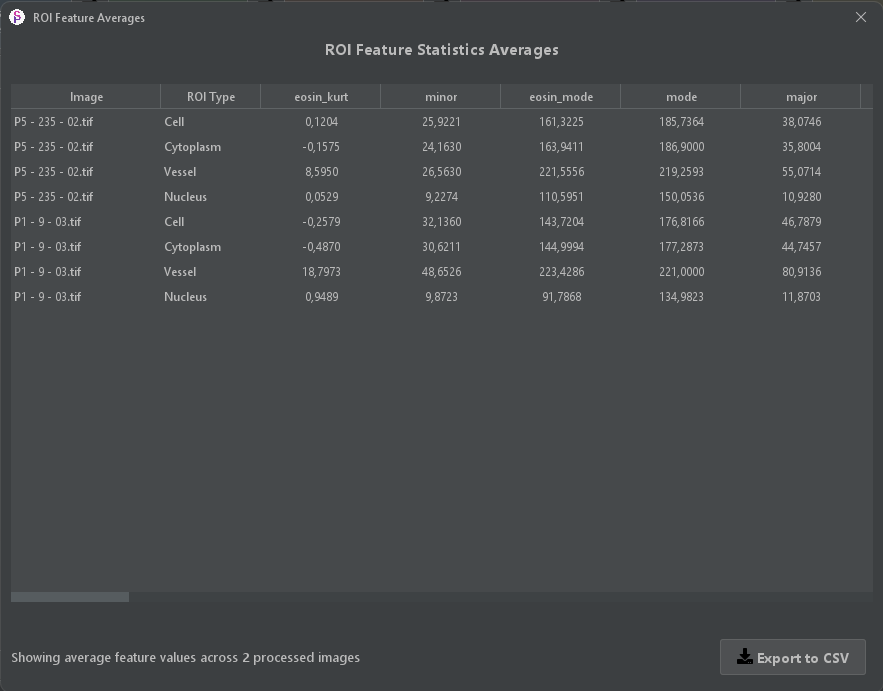
ROI Feature Averages
- Aggregated Data: Useful for comparing general characteristics between different images or experimental conditions.
- Grouped by Type: Averages are calculated separately for Cells, Cytoplasms, Vessels, and Nuclei.
4. Cluster Visualization
The Cluster Colors view visualizes the results of the unsupervised classification (clustering) directly on the image.
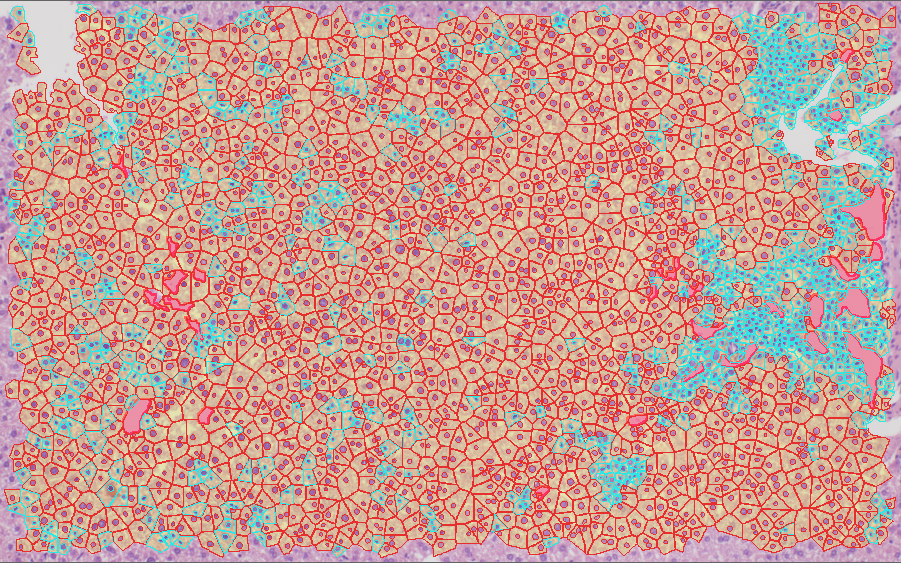
Cluster Visualization Overlay
- Color-Coded Segments: Each cell is colored according to its assigned cluster (e.g., Cluster 1 in red, Cluster 2 in cyan).
- Spatial Distribution: Allows you to easily identify spatial patterns and groupings of similar cells within the tissue.
Final Analysis
Overview
The Final Analysis panel provides summary statistics and comprehensive reporting options.
Summary Statistics
- Total Counts: Number of cells, nuclei, and vessels detected
- Class Distribution: Percentage breakdown by cell class
- Area Coverage: Tissue area occupied by each region type
- Density Metrics: Cells per unit area calculations
Comparative Analysis
- Compare Classes: Statistical comparison between cell types
- Feature Distributions: Histograms and box plots for each feature
- Correlation Matrix: Relationships between features
Report Generation
- PDF Report: Generate a formatted analysis report
- Excel Export: Create spreadsheets with multiple sheets
- Image Montage: Create figure panels for publication
Statistical Tests
- T-test: Compare means between two groups
- ANOVA: Compare means across multiple groups
- Correlation Analysis: Pearson and Spearman correlations
Features Explained
ROI Types
SciPathJ extracts features from four types of Regions of Interest (ROIs):
1. Nucleus
The nucleus is detected using hematoxylin staining. Features extracted include nuclear size, shape, and staining intensity.
2. Cytoplasm
The cytoplasm region extends from the nucleus boundary. Features include cytoplasmic area, eosin staining intensity, and texture patterns.
3. Complete Cell
The complete cell combines nucleus and cytoplasm. Features represent the entire cell including overall shape and combined staining characteristics.
4. Vessel
Vessels are detected based on their characteristic elongated shape and lumen structure. Features include vessel area, perimeter, and branching patterns.
Feature Categories
SciPathJ extracts a comprehensive set of features for each detected object. These are categorized below:
Metadata & Identification
| Feature | Description |
|---|---|
| Image Name | Name of the source image file |
| Cell Type | Type of ROI (Cell, Nucleus, Cytoplasm, Vessel) |
| ROI ID | Unique identifier for the region within the image |
| Predicted Class | Class assigned by the supervised machine learning model |
| Confidence | Confidence score of the prediction |
| Cluster | Cluster ID assigned by unsupervised classification |
| ignore | Flag indicating if the ROI should be excluded from analysis |
| Feature | Description |
|---|---|
| area | Area of selection in square pixels or calibrated units (e.g., µm²). |
| perim | The length of the outside boundary of the selection. |
| width | Width of the smallest rectangle enclosing the selection. |
| height | Height of the smallest rectangle enclosing the selection. |
| major | Length of the primary axis of the best fitting ellipse. |
| minor | Length of the secondary axis of the best fitting ellipse. |
| angle | Angle (0-180 degrees) between the primary axis and a line parallel to the x-axis of the image. |
| circ | Circularity: 4π × Area / Perimeter². A value of 1.0 indicates a perfect circle. As the value approaches 0.0, it indicates an increasingly elongated shape. |
| round | Roundness: 4 × Area / (π × Major_Axis²), or the inverse of the aspect ratio. |
| ar | Aspect Ratio: Major_Axis / Minor_Axis. |
| solidity | Solidity: Area / Convex Area. |
| feret | Feret's Diameter: The longest distance between any two points along the selection boundary (maximum caliper). |
| minferet | Minimum Feret's Diameter: The minimum caliper diameter. |
| feretx, ferety | Starting coordinates of the Feret's diameter. |
| feretangle | Angle (0-180 degrees) of the Feret's diameter. |
| bx, by | Coordinates of the upper left corner of the bounding rectangle. |
| x, y | Centroid: The center point of the selection (average of x and y coordinates of all pixels). |
| xm, ym | Center of Mass: Brightness-weighted average of the x and y coordinates. |
Intensity Features (General)
| Feature | Description |
|---|---|
| mean | Mean Gray Value: Average gray value within the selection. |
| median | The median value of the pixels in the image or selection. |
| mode | Modal Gray Value: Most frequently occurring gray value within the selection. |
| min | Minimum gray value within the selection. |
| max | Maximum gray value within the selection. |
| stddev | Standard Deviation of the gray values used to generate the mean gray value. |
| skew | Skewness: The third order moment about the mean. |
| kurt | Kurtosis: The fourth order moment about the mean. |
| intden | Integrated Density: The product of Area and Mean Gray Value. |
These features are calculated specifically for the Hematoxylin (nuclear) and Eosin (cytoplasmic) channels after color deconvolution.
| Feature | Description |
|---|---|
| hema_mean, eosin_mean | Mean intensity for Hematoxylin/Eosin channel |
| hema_median, eosin_median | Median intensity |
| hema_mode, eosin_mode | Mode intensity |
| hema_min, eosin_min | Minimum intensity |
| hema_max, eosin_max | Maximum intensity |
| hema_stddev, eosin_stddev | Standard deviation |
| hema_skew, eosin_skew | Skewness |
| hema_kurt, eosin_kurt | Kurtosis |
Spatial Features
| Feature | Description |
|---|---|
| neighbor_count | Number of neighboring cells within a defined radius |
| closest_neighbor_distance | Distance to the nearest neighboring cell |
| vessel_distance | Distance to the nearest vessel |
Need More Help?
If you can't find what you're looking for in the documentation, here are additional resources: